Eighth Grade Standards
The Overview (from the Common Core website)
- The Number System
- Know that there are numbers that are not rational, and approximate them by rational numbers.
- Games using rational and irrational numbers : Math-play.com, SoftSchools.com
- Movies: Brian Pop
|
|
Expressions and Equations
- Work with radicals and integer exponents.
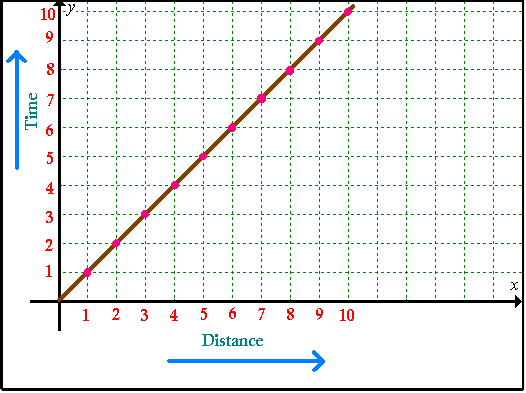
- Understand the connections between proportional relationships, lines, and linear equations.
- Analyze and solve linear equations and pairs of simultaneous linear equations.
- Alien Invader exponent game! http://www.ezschool.com/Games/Exponents.html
The graph of y=x
|
y=x+1
|
Functions
- Define, evaluate, and compare functions.
- Use functions to model relationships between quantities.
- Games: Math-play.com, Ezschool
- Here is a video demonstrating the function machine principle. http://vimeo.com/4231208
- Worksheets: Math Aids (this site allows you to edit worksheets to use in your own classroom!)

- Below is a visual representation of how a pig is a magical function machine that converts the inputs (fruit, vegetables, and other garbage) into the delicious output, bacon.
Charlotte’s Function Machine
(pig is the function machine, apple is the input, delicious bacon is the output)
(pig is the function machine, apple is the input, delicious bacon is the output)

|

|

|

|

|
Geometry
- Understand congruence and similarity using physical models, transparencies, or geometry software.
- Understand and apply the Pythagorean Theorem.
- Solve real-world and mathematical problems involving volume of cylinders, cones and spheres.
- Games: Math-play.com, Factmonster.com, Factmonster.com
Statistics and Probability
- Investigate patterns of association in bivariate data.
- CCSS.Math.Content.8.SP.A.1 Construct and interpret scatter plots for bivariate measurement data to investigate patterns of association between two quantities. Describe patterns such as clustering, outliers, positive or negative association, linear association, and nonlinear association.
- CCSS.Math.Content.8.SP.A.2 Know that straight lines are widely used to model relationships between two quantitative variables. For scatter plots that suggest a linear association, informally fit a straight line, and informally assess the model fit by judging the closeness of the data points to the line.
- CCSS.Math.Content.8.SP.A.3 Use the equation of a linear model to solve problems in the context of bivariate measurement data, interpreting the slope and intercept. For example, in a linear model for a biology experiment, interpret a slope of 1.5 cm/hr as meaning that an additional hour of sunlight each day is associated with an additional 1.5 cm in mature plant height.
- CCSS.Math.Content.8.SP.A.4 Understand that patterns of association can also be seen in bivariate categorical data by displaying frequencies and relative frequencies in a two-way table. Construct and interpret a two-way table summarizing data on two categorical variables collected from the same subjects. Use relative frequencies calculated for rows or columns to describe possible association between the two variables. For example, collect data from students in your class on whether or not they have a curfew on school nights and whether or not they have assigned chores at home. Is there evidence that those who have a curfew also tend to have chores?
The Birthday Problem
What we want to do here is figure out what is the likelihood that any number (n) of people share a birthday on the same day. We will ignore any complicating factors like leap years and twins. We will also assume that all birthdays are independent events. I.e. the occurrence of any one birthday has no effect on the occurrence of any other birthday.
To figure out the probability of a particular outcome in a series of independent events, we multiply the probability of each event by the probability of each other event taking place and subtract from 1. This gives us the likelihood as a percentage of some relationship between independent events.
To get the probabilities of any numbered group of people where there exists a common birthday, we would want to calculate the probability that this number of people doesn’t have a birthday in common and then subtract that percentage from one. This may seem like working backwards, but in either way, ie first determining the likelihood of shared birthdays or all different birthdays, we will have to find the same information.
The formula is set up like this: P(same b-days)= 1 – (P(diff b-days)).
One of the basic rules of probability is that the sum of the probability that an event will happen and the probability that the event won’t happen is always 1. So to find out the probability of one, we will end up finding the probability of both. We use knowing the probability of one outcome to learn the probability of the other by subtracting from 1.
To find the percentage of birthdays that are the same among a group of people, we will first find the percentage likelihood that all birthdays in that group are different.
Now, the likelihood that any 2 people have different birthdays is very high. It is 364/365. Or you could express it as there is a 1/365 chance that their birthdays are the same.
Now the likelihood that any three peoples' birthdays are all different is 363/365. This is because there are now 2 chances out of 365 for birthdays to be the same. With 4 people the likelihood they have different birthdays becomes 362/365. With 5 people the likelihood that they have different birthdays is 361/365. And the pattern continues on down the number line, each extra person taking a digit off the numerator over the 365.
Real quick, to figure out the likelihood that 6 people have different birthdays we would calculate this problem:
365/365 x 364/365 x 363/365 x 362/365 x 361/365 x 360/365
364 x 363 x 362 x 361x360 = 6216218648640
365^5= 6478348728125
Divide these two for the percentage that 6 people will have different birthdays. And the percentage is 96%. Thus, there is a 4% chance that 6 people will share the same birthday.
Let’s go ahead and figure out the probability that there is a same birthday in our class with however many people are here today. Because of the huge numbers involved, like 365^15, we will have to use a graphing calculator or a computer. There is a way of simplifying this formula using the natural log, but for simplicity’s sake today, we’ll just crunch these huge numbers. This problem is complicated enough that it can be revisited throughout a semester as different aspects of the birthday problem become focused upon. For example during a lesson on natural logs, it could be applied to the by then familiar birthday problem.
Mathematical Practices
1. Make sense of problems and persevere in solving them.
2. Reason abstractly and quantitatively.
3. Construct viable arguments and critique the reasoning of others.
4. Model with mathematics.
5. Use appropriate tools strategically.
6. Attend to precision.
7. Look for and make use of structure.
8. Look for and express regularity in repeated reasoning.
